Pradipta Biswas
Assistant Professor
Centre for Product Design and Manufacturing, Indian Institute of Science, Bengaluru
1. Description of Idea
One of the main differences between developed and developing countries in the context of manufacturing is cost and skill of manpower. Any initiative for complete automation in a developing country undermine availability of cheap manpower. IISc smart manufacturing initiative works closely with local SMEs and does not only investigate automation but also try to deskill existing workforce. A video demonstration of the system can be found at https://youtu.be/zcQNaT_NzbQ
The proposed system (figure 1) helps in making decision by tracking people, resource and their working environment and consists of the following parts
1. IoT unit with a single-board computer for environment, people and process tracking
2. An interactive visualization module
3. An early warning system
4. Automatic fault detection module
In the following sections we have briefly described each of these modules.
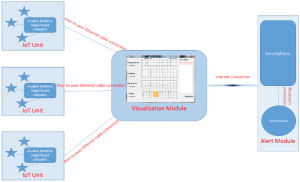
Figure 1. Different Modules of the System
1.1. IoT Node
Each IoT node consist of a single-board computer and a set of sensors. The single board computer records data from different sensors and fuse sensor signals, when required. Presently, we developed the IoT node for environment tracking using MQ-5 Smoke Sensor, HL-83 Flood / Rain Sensor and a DS18B20 Temperature Sensor. In the following sections, we described the interface of different sensors.
Figure 2 below describes the connection of the sensors to a pcDuino single board computer. The black line in the figure shows the connection of the sensors to the in-built Arudino shield of the pcDuino computer while the red line depicts external power supply to the sensors. The pcDuino is connected to a desktop computer running the visualization module over a peer-to-peer connection.
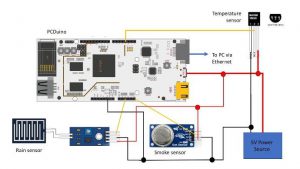
Figure 2. Interfacing sensors to single board computer
Posture Tracking: We also developed an IoT node for posture tracking. We have developed a prototype system using a Kinect that can detect bad leaning posture by measuring the difference between the neck-spine and hip-spine joints in the skeleton figure of Kinect. Following RULA guidelines, it raises an alert when the neck or torso is inclined more than 60 ͦ. (figure 3). However, unlike other IoT nodes, this node requires a Windows computer to interface with the Kinect sensor.
Torso turned less than 60 ͦ., indicated by the blue dots in the Kinect Skeleton Model Torso turned more than 60 ͦ., indicated by the red dots in the Kinect Skeleton Model.
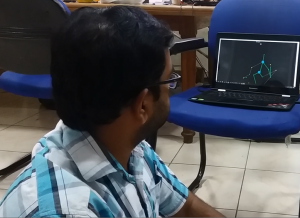
Torso turned less than 60 ͦ., indicated by the blue dots in the Kinect Skeleton Model
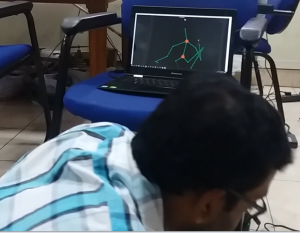
Torso turned more than 60 ͦ., indicated by the red dots in the Kinect Skeleton Model
Figure 3. Posture Tracking using Kinect skeleton model
1.2. Visualization Module
This module runs on a standard desktop or laptop computer attached to a screen and a projector. The screen and projector will render the display in extended mode. We have developed a software that renders webcam or CCTV display or just a picture of the floor layout of the factory on one display and sensor reading on the other display. The main electronic display is designed to display spatial information and it is overlaid with information about spatial location of sensors (figure 4). We represented sensor readings by colour code so that a glance at the main display can detect any anomaly in sensor reading and its relative position in the factory floor. The yellow dots in figure 4 changes colour to amber and red based on severity in the reading of sensors.
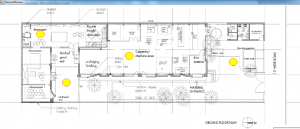
Figure 4. Spatial information of sensors on main display
The projected display is used to render temporal data and shows sensor reading over time as a line graph (figure 5) and out of trend readings are indicated by bar graph. A single button press can switch displays. Both displays can show additional information on sensor reading and surroundings on mouse click events.
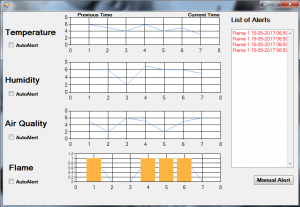
Figure 5. Temporal information of sensor readings on projected display
A pico-projector renders the display on the electronic screen itself but at a lower brightness level than the screen itself (figure 6). If a semi-transparent sheet (figure 7) is held in front of the screen, then only the projected display turns visible. For example, if a user wants to take sensor readings of a particular part of the assembly line, he holds a semi-transparent screen in front of the main electronic display of the floor and can observe temporal trend of sensor readings (figure 6). The projected screen consists of layered translucent sheet, held together by a frame. The frame also has a handle to hold the device in hand (figure 7).
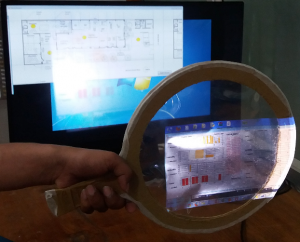
Figure 6. Proposed Visualization System
1.3. Early Warning System
The visualization module is integrated to an analytics and alert module that constantly analyses data recorded from sensors and set out an alert if any values cross a threshold. The user can send either a manual alert or set up an automatic alert for one, all or a subset of sensors using the graphical user interface provided with the visualization module. The alert is send as a Gmail to a pre-recorded email address. We chose Gmail as alert platform as sending a SMS requires the visualization module to be integrated with a telephone communication unit, while social networking messages (like Facebook or WhatsApp alert) require the end user to subscribe to a social networking site. The Gmail can be received on a smartphone or smartwatch. The Gmail message summarizes sensor readings and has a subject stating the type of sensor creating the alert.
1.4. Fault Detection Module
Faults such as tearing’s, holes slight openings on the given product are considered as the discrepancies. These descrepancies was detected with suitable lighting conditions and the following blob detection method. In the proposed methodology , a stream of images are taken from the camera which is placed at a slant angle on the experimental setup. The pre-processing step is made by applying the bilateral filter on the taken images stream to smooth the images without smoothing the sharp edges. The product surface is determined using the Canny edge detection and followed by the Morphological transformation for better formation of the edges. Finally, blobs around the defected or faulty areas are formed using the contour formation technique on the surface images and 2D convolution masking is done for having a binary image. Finally, blob detection method is applied on the binary image, which outputs the blobs location along with the timestamp.
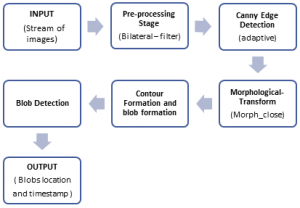
Figure 7: Showing the sequential steps involved in the proposed method for detecting the faults.
2. Scalability in Indian Context
The proposed smart manufacturing set up was tuned towards Indian SMEs. All components for environment, people and resource tracking were developed using low cost commercially available systems. The sensors, computers and associated software were selected based on their cost and reusing existing resources already available in SMEs (like desktop PCs). The augmented reality system (figure 6) is frugally developed which can easily be integrated with existing desktop PC. As explained in figure 1, the number of IoT modules can be scaled up according to the size of the industry and can be connected to a central server using both wired and wireless connection. Based on the requirement and physical distribution, multiple visualization modules can be set up and connected as Mobile Ad-Hoc Network (MANET).
3. Impact
The project is implemented in a university and yet to be deployed in an industry. The project team is already working with a few SMEs for requirement generation and personalizing deployment for each individual industry. Once completed, the project intends to develop a small but realistic version of a smart assembly line in which parts will be brought together from supply chain, and inspected, integrated, and tested for small-batch manufacturing for a biomedical device, in order to investigate the following:
· Analytics on Process: Automated collection of data on process (e.g. use of steps and tools), and analytics on the data to understand how well the process is followed and its impact on quality, productivity and cost.
· Analytics on People: Automated collection of data on people working in the factory, and analytics on their behaviour to understand its impact on quality, productivity and safety.
· Analytics on Resources: Automated collection of data on resources (e.g. materials, energy and emissions), and analytics to understand resource utilisation and its impact on cost, safety and sustainability.
For more Information : https://cambum.net/I3DLab/Research.htm